How we calculate a savings
When the energy crisis hit, energy suppliers pulled their fixed deals from the market which meant that for the first time in 20 years Uswitch was unable to switch people’s energy plans. People felt very unsettled because of the change, so this product was created to respond to the crisis.
Role
UX
User research
Time
5 weeks

Should we still show a saving?
Uswitch was concerned that the savings number would be incorrect given the challenge of a new energy market. To ensure users could continue to make a confident decision, the business wasn’t sure if we should still be showing a saving number.
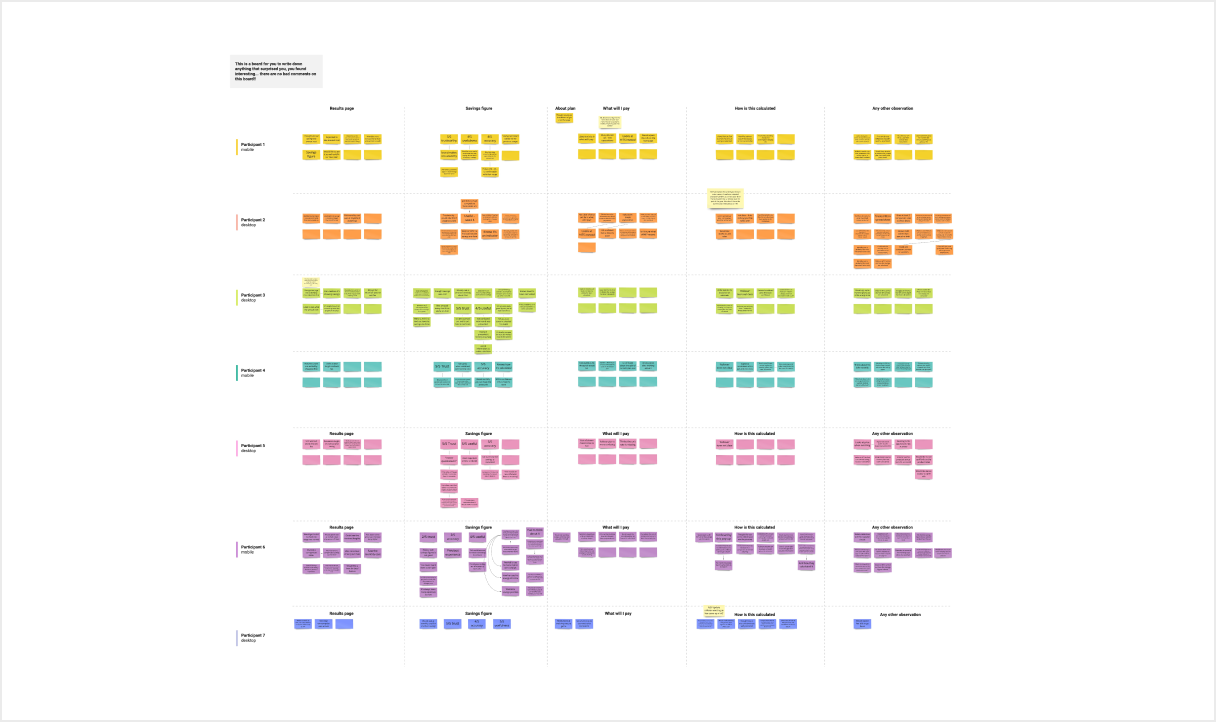
We ran a series of interviews to find out if a savings figure was still a compelling reason for our users to switch their energy plan.
We establised that all participants were interested in saving money above all else. So we decided that finding a new method to calculate a savings number was the right direction.
We also wanted to create a benchmark on trust, usefulness and accuracy of the current savings method. This would help us to determine how/if our new method would affect our users.

How could we calculate a saving?
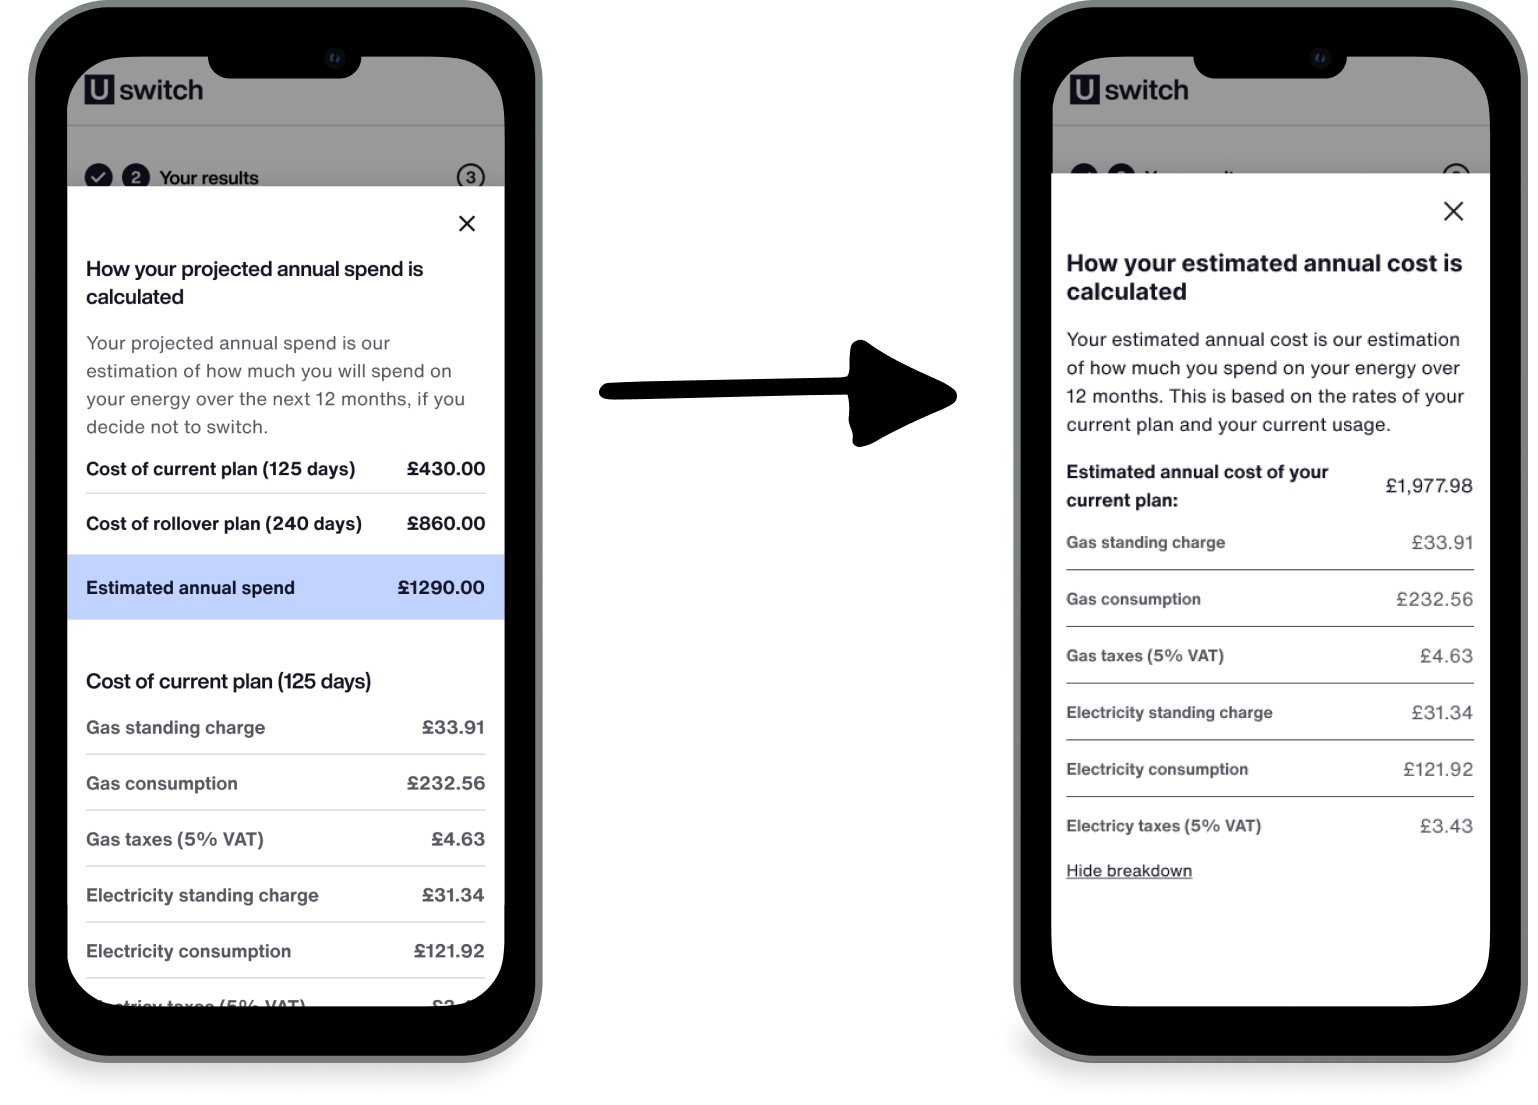
The original saving method was a projection of what they could save over the next 12 months from the day they checked on Uswitch.
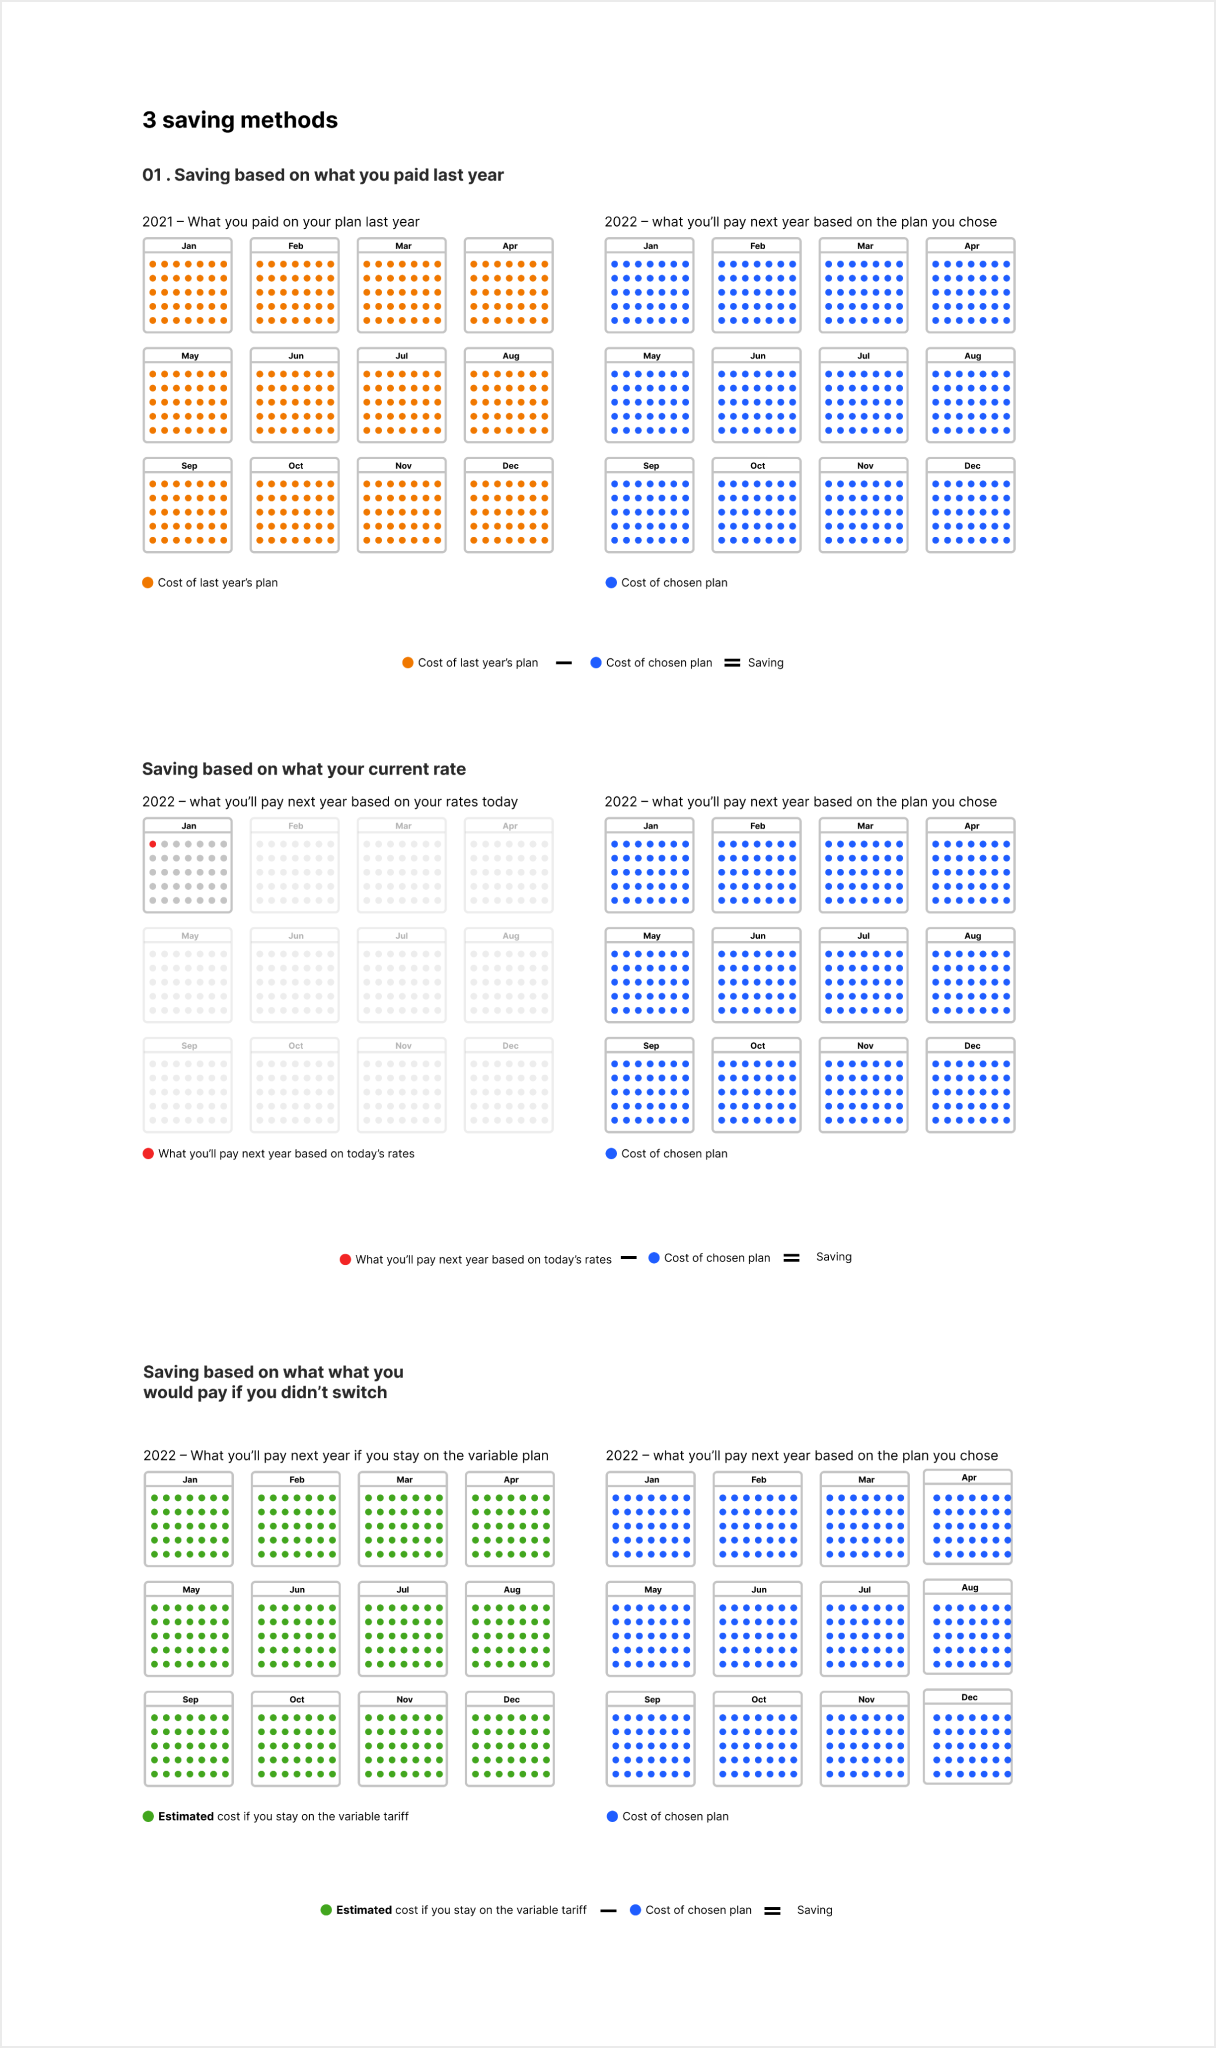
We worked with the policy team and came up with 3 ways to calculate a saving:
- Based on the past
Compare what they would pay over the next 12 months to what they paid over the past 12 months - Based on today
Compare the rates they would pay with a new plan with the rates of their existing plan - Based on a projection
Compare what they would pay over the next 12 months with their selected plan to what they would pay if they stayed on the price cap rate

Everyone had a different view on which one we should use. The challenge we faced was to find out which one would be most useful to our users and then get all the teams to agree with that method.
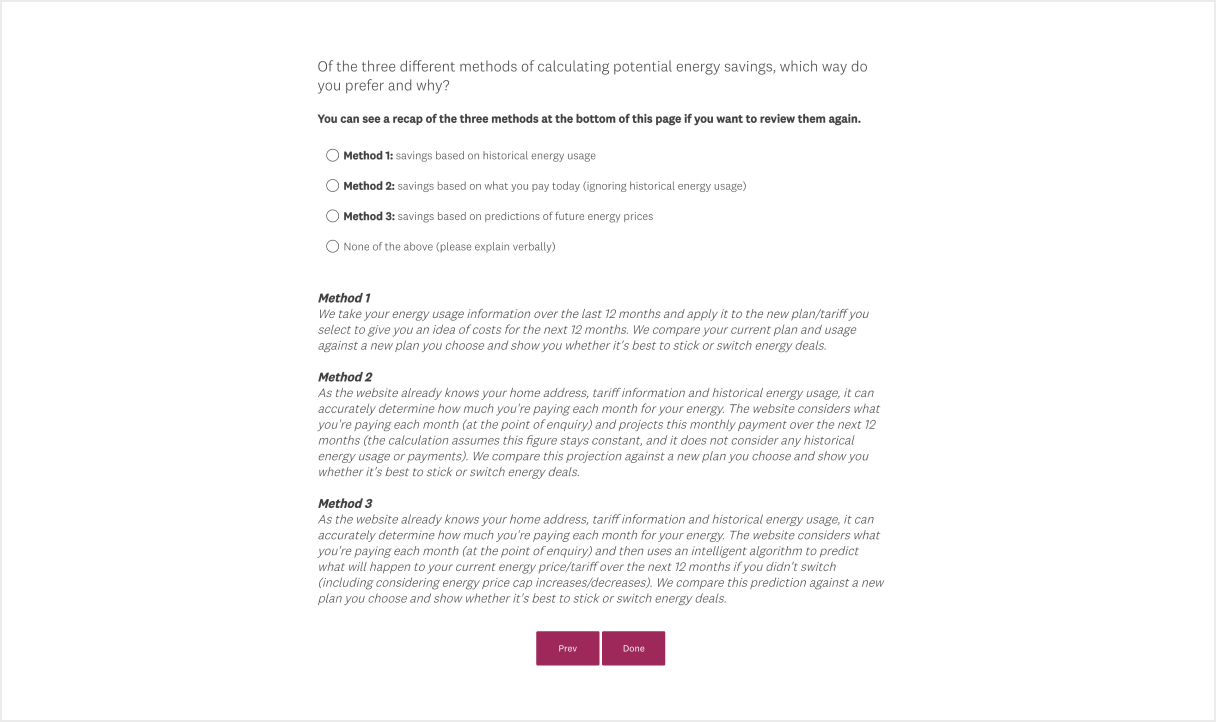
It was important to find out what participants thought of each method and which one they preferred. I worked with our UX researcher and launched a preference test.

There was a 50/50 split between two of the methods. This meant we now had to figure out if we should only give users one option or let them choose which one to use.
I created a prototype with the aim of finding out if they preferred having a choice of savings, which one they preferred and how likely they thought they were to get the savings numbers.
4/6 participants preferred having 1 choice
- there was a 50/50 split between which saving number to use
- 4/6 participants thought that it was highly likely they would get the savings number based on what their cost could be over the next 12 months
With this information we decided to show only one savings number and base that saving on what they pay today. We felt it would be misleading to use a savings number based on what their cost could be over the next 12 months since participants thought it was very likely would get that saving.
Thoughts on the project
It was a challenging project but incredibly satisfying bringing stakeholders with differing points of view to a consensus.
I would have liked to have spun off a project looking at how we could project costs for the next 12 months for our users. There was a clear interest from half of them so it would have been a great opportunity to create a valuable product and increase our brand authority.
I could have reached the result faster if we had just mocked up all 3 options instead of doing the preference test. Having a visual of the methods was far more effective at communicating them than definitions of them.
Creating a visual of the options was super useful and once we had it all the team and stakeholders were better able to understand the differences.